 The Independent Uganda: You get the Truth we Pay the Price
Mobile money to the rescue as banking sector remains too shallow to leverage financial inclusion
COMMENT | ENOCK NYOREKWA TWINOBURYO | In line with statutory requirements, all banks are supposed to publish their financial statements by the end of April of each year. The published banks’ results for 2017 are out and the total assets increased by 18% reaching Shs26.6 trillion in December 2017. This translates to 27% of GDP, which suggests that Uganda’s banking sector remains shallow to leverage financial deepening.
For example, the share of banks assets to GDP in Uganda is the same as average of the private sector credit to GDP in the Sub Sahara Africa region. Arguably too small to warrant any mention in the April 2018 IMF Global Financial Stability Report.
The limited asset base of the banks in part explains why Uganda’s private sector credit as share of GDP is half the SSA average. It is also constrained arguably by banks investing 20% of its assets in government securities – with year to year growth commensurate to the asset growth of 18% to reach Shs5.4 trillion in 2017.
Juxtaposed with private sector credit growth of 6% in 2017, it implies that the banks took a fairly risk neutral position – inclining towards risk free government securities. Although there is a potential of multiple applications, only one in two of loan applications was approved in 2017. The backdrop is anecdotal to the crowding out of the private sector.
According to the asset composition drawn from the published statements, it can also be argued that the banking sector remains oligopolistic in nature despite being composed of 24 banks. Only eight banks have an asset value of more than Shs1 trillion, of which only three made net profits in excess of Shs100 billion. These top 8 banks by asset account for 77% of the total assets and 89% of profitability.
Stanbic bank (which bought Uganda Commercial Bank for US$21.3 million in 2002 and made the same money in income the same year) remains the most profitable bank – reaching Shs 200 billion for first time owing largely from undercutting costs (by Shs17 billion) as opposed to increased income.
The latter reduced mainly due to interest income reduction attributed to declining interest rates consistent with the monetary stance (reduction of the Central Bank Rate over the last 12 months). The second largest bank by asset and profits is now DFCU bank following its takeover of Crane Bank and it had its net profits cross the Shs100 billion mark for the first time ever.
Its net profits grew by 280% to Shs127 billion. Centenary bank which is the fourth largest by asset was the third most profitable with Shs100 billion, however, registering a reduction of Shs9 billion from 2016 profits.
Standard Chartered Bank the third largest bank by asset has for the 2nd time in last six years seen its profits go less than Shs100 billion and its convergence with Stanbic Bank has since been compromised.
Overall, the total banking profitability increased to Shs770 billion in 2017 from Shs676 billion in 2016 but remains skewed towards the top 10.
The struggle is real at the bottom, with loss making banks increasing to six compared to four in 2016 and 2015. The banking sector cost to income ratio remained high at 73% in 2017 from the 85% in 2016 but is still higher than the historical average.
This is why most banks have broadly focused on balance sheet repairing; including taking cost cutting measures by reducing bank branches – remaining concentrated in urban areas; particularly Kampala. As such, the share of non-performing loans to total gross loans reduced to slightly less than 6% from over 10% in 2016.
In a nutshell, the banking sector remains shallow, small, dominated by a few banks, and with limited credit penetration which suggests that the banks are not the most optimal modality for financial inclusion.
Mobile money by far as underlined in the 2016 financial inclusion strategy is a conduit for inclusion. The proportion of Ugandans using mobile money is by far greater than for any other financial services in Uganda, which is why arguably the 1% tax on mobile money transactions will be regressive.
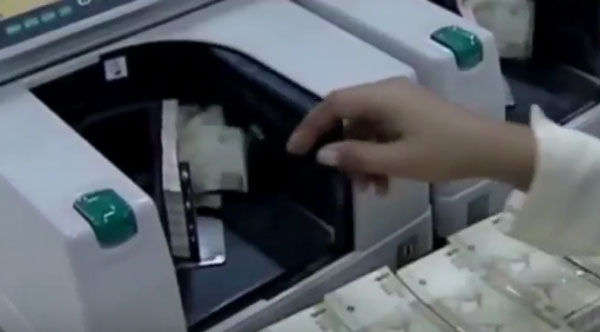
The total value of mobile money transactions for the financial ending June 2017 had reached Shs53 trillion (over 55% of GDP) from Shs38 trillion in 2016. Cognizant that nearly eight million people use of mobile money, Bank of Uganda as the champion of financial inclusion ought to provide effective policy advisory in this realm, in light of the recent reversal of poverty, inequality, and other development goals.
****
Dr Enock Nyorekwa Twinoburyo, Economist based in Kigali