 The Independent Uganda: You get the Truth we Pay the Price


Kampala, Uganda | THE INDEPENDENT | Uganda’s National Livestock Census (NLC) results indicate near double growth in the country’s total population of cattle, goats, sheep, pigs, poultry, rabbits, and pack animals between 2008 and 2021.
There has been a 27.2% increase in the cattle population, an increase of 54.5% in the chicken population, while the pig population shot up by 100% in three years.
The livestock census conducted by the Uganda Bureau of Statistics (UBOS) and released recently in Kampala, also indicated a five-fold increase in the milk production in the country. The total milk production in 2021 was estimated at 71.7 million litres per week, translating to an annual production of 3.7 billion litres compared to 667.5 million litres recorded in 2008.
UBOS together with the Ministry of Agriculture, Animal Industry and Fisheries (MAAIF) undertook the National Livestock Census (NLC) in May 2021. This was in line with a World Programme for the Census of Agriculture 2020.
The NLC 2021 revealed that there were 6.8 million households that were keeping at least one Livestock type. This is estimated to be about 72.8 percent of the 9.3 million projected households in 2021.
The NLC 2021 is intended to provide data to government, local authorities, researchers, academia, and other stakeholders to aid planning and decision-making processes.
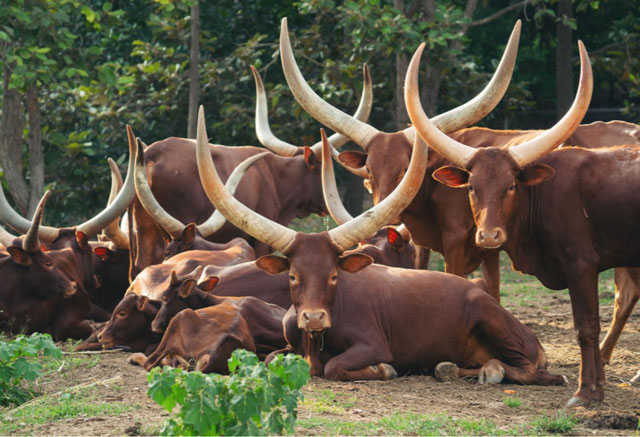
Cattle population
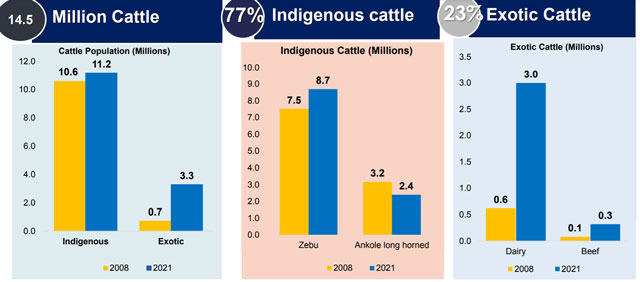
The national total cattle population is 14.5 million cattle. This is an increase in the cattle population by 27.2 percent from 11.4 million cattle in 2008.
Results also indicate that more than 50.0 percent of livestock keeping households keep livestock for subsistence purpose.
The total population of indigenous breeds was 11.2 million in 2021 compared to 10.6 million in 2008, while that of exotic /cross was 3.3 million compared to 0.7 million in 2008.
The NLC data shows that the total number of cattle-keeping households was estimated at 2.3 million, constituting 33 percent of 6.8 million livestock-keeping households in 2021. The average herd size for cattle keeping household is 6 heads of cattle.
The regional distribution of the total cattle population as per the NLC 2021 findings show that, the Eastern and Western regions had the highest number of cattle estimated at 3.3 million cattle (23 percent), followed by the Central region with 3.0 million cattle representing 20.8 percent and least was recorded in the Northern as well as Karamoja with about 2.4 million cattle representing 17 percent.
Sub-regional analysis indicated that Karamoja had the highest number of cattle with 2.4 million (16.7%). This was followed by Ankole with 1.8 million (12.4%) and Buganda North with 1.6 million (11.0%). The least number of cattle were reported in Kigezi with 305,000 cattle (2.1%) and Bukedi with 469,000 cattle (3.2%).
Sheep Population
The total sheep population is 4.4 million in 2021, an increase of 27.8 percent from 3.4 million sheep reported in 2008. Indigenous sheep constituted 98.2 percent of the total sheep population in Uganda, while exotic/cross breed represented 1.8 percent.
Karamoja region had the highest sheep population of 1.8 million, contributing 40.4 percent to the national herd size.
This was followed by Western region with about 900,000, contributing 20.6 percent to the national herd size.
Sub-regional analysis indicated that Karamoja had the highest number of sheep with 1.8 million (40.4%). This was followed by Teso with 405,000 (9.3%) and West Nile with about 398,000 sheep (9.1%). The least number of sheep were reported in Busoga with 55,000 sheep (1.3%), and Bukedi with 65 ,000 sheep (1.5%).
Goat Population
The total goat population is 17.4 million goats in 2021, an increase of 39.4 percent from 12.4 million goats reported in 2008. Indigenous goats constituted 97.2 percent of the total goat population, while exotic/cross constituted 2.8 percent.
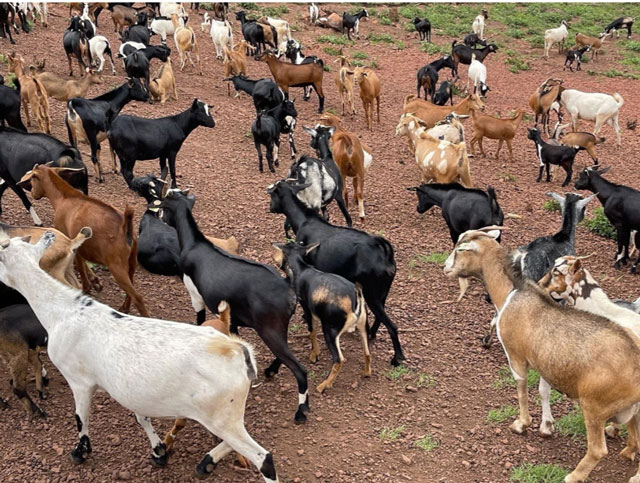
Western region had the highest goat population of 4.6 million, contributing 26.3 percent to the national herd size. This was followed by Northern region with 4.1 million, contributing 23.4 percent to the national herd size.
Sub-regional analysis indicated that Karamoja had the highest number of goats with 2.6 million (15.2%). This was followed by West Nile with 1.99 million goats (11.5%) and Ankole with about 1.98 million goats (11.4%). The least number of goats were reported in Bukedi with 508 thousand goats (2.9%) and Elgon with 569 thousand goats (3.3%).
At district level, Amudat with 1.1 million goats, followed by Kaabong with 515,000 goats, Kotido with 492,000 goats, and Isingiro with 422,000 had the highest goat population in the country in 2021.
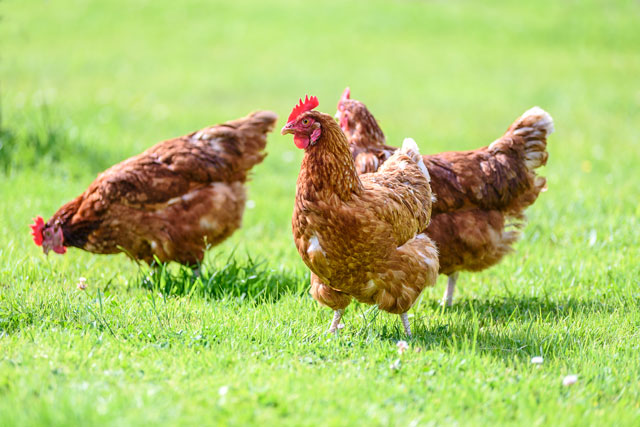
Chicken Population
In 2021, the chicken population was 57.8 million, an increase of 54.5 percent from 37.4 million chicken reported in 2008. Indigenous chicken constituted 69.9 percent while exotic/cross breed represented 30.1 percent.
The Central region had the highest population of 20.7 million chicken representing 35.7 percent of the total chicken population. This was followed by Eastern region with 15.8 million (27.3%), while Karamoja region had the least number of chicken with 1.4 million (2.6%).
Sub-regional analysis indicated that Buganda South had the highest number of chickens with 11.2 million contributing 19.3 percent of the total chicken population. This was followed by Buganda North with 9.5 million (16.4%) chicken and Busoga with 5.6 million (9.7%) chicken. The least number of chicken was reported in Kigezi with 1.0 million (1.8%) and Karamoja with 1.5 million (2.6%) chicken.
At district level, Wakiso had the highest chicken population with 5.6 million chicken, followed by Mukono with 3.4 million chicken and Luwero with 1.4 million chicken.
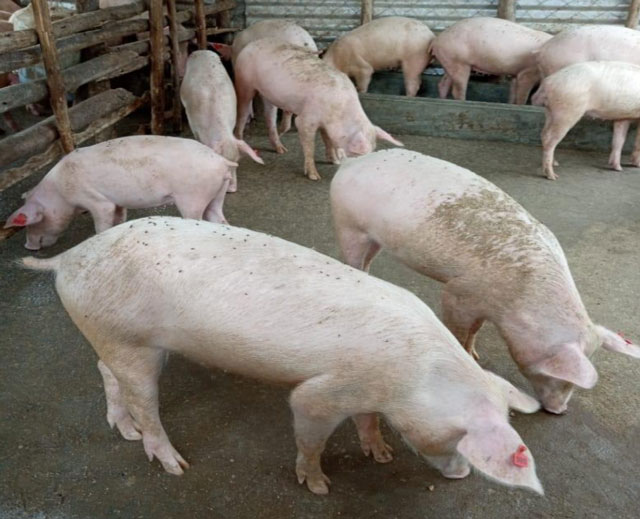
Pig Population
The total pig population was 7.1 million in 2021, an increase of 122.5 percent from 3.2 million pigs reported in 2008.
At regional level, Western and Central regions each with about 2.3 million pigs the highest pig population with each contributing about 32 percent to the national herd size. Karamoja region had the least population with about 82,000 pigs contributing only 1.2 percent to the total pig population.
Sub-regional analysis indicated that Buganda South had the highest number of pigs with 1.2 million pigs (17.2%). This was followed by Buganda North with 1.1 million (15.0%) pigs and Bunyoro with 0.7 million (10.5%). The least number of pigs were reported in Karamoja with 82,000 pigs (1.2%) and Bukedi with 227,000 (3.2%).
At district level, Wakiso with 426,000 pigs, followed by Mukono with 231,000 pigs, and Kagadi with 195,000 had the highest pig population in the country in 2021.
Rabbit Population
The total rabbit population was 2.2 million in 2021, a five-fold increase in the rabbit population from 373,200 rabbits reported in 2008.
Sub-regional analysis indicated that Buganda South had the highest number of rabbits with 499,000 (22.3%). This was followed by Ankole with 393,000 rabbits (17.6%) and Tooro with 272,000 rabbits (12.2%). The least number of rabbits were reported in Karamoja with about 3,000 rabbits (0.1%) and Lango with about 31,000 rabbits (1.4%).
At district level, Wakiso with 236,000 rabbits, followed by Kasese with 75,000 rabbits, Ntungamo with 72,000 and Bunyangabu with 71,000 had the highest rabbit population in the country in 2021.
Population of Pack Animals
The population of donkeys was 63,000 in 2021, which was a decrease of 56.3 percent from 144,000 donkeys reported in 2008. The population of Camels in Uganda was 12,000 camels.
Sub-regional analysis indicated that Karamoja had the highest number of donkeys with 46,000 and camels with about 10,000.
Beehives
In NLC 2021, the total number of hives was estimated at 2.6 million hives. This was a twofold increase from the 747,000 hives reported in 2008.The number of colonised hives at the date of interview was reported at 1.8 million representing 72.0 percent of all the hives in 2021.
******
SOURCE: UBOS
READ FULL REPORT HERE NLC 2021 Shared Presentation